#代码
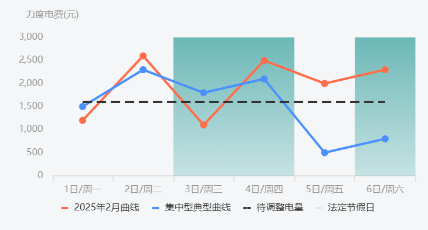
可以新增一个 series.bar,设置 data 值为 null 的数组,设置 series.bar.tooltip 为 false,再通过 markArea 来标记区域。
此时还能通过 legend 来控制是否显示标记区域。
json{
  "name": "法定节假日",
  "type": "bar",
  "tooltip": {
    "show": false
  },
  "legend": {
    "itemWidth": 6,
    "itemHeight": 6
  },
  "barWidth": "60%",
  "data": [null, null, null, null, null, null],
  "itemStyle": {
    "color": "rgba(80, 202, 196, 0.2)"
  },
  "markArea": {
    "itemStyle": {
      "color": {
        "type": "linear",
        "x": 0,
        "y": 0,
        "x2": 0,
        "y2": 1,
        "colorStops": [
          {
            "offset": 0,
            "color": "rgba(16, 143, 139, 0.6)" // 0% 处的颜色
          },
          {
            "offset": 1,
            "color": "rgba(16, 143, 139, 0.2)" // 100% 处的颜色
          }
        ]
      }
    },
    "data": [
      [
        {
          "xAxis": "3日/周三"
        },
        {
          "xAxis": "4日/周四"
        }
      ],
      [
        {
          "xAxis": "6日/周六"
        },
        {
          "xAxis": "6日/周六"
        }
      ]
    ]
  },
  "z": -1
}
#预览